Tracing
Tracing is the act of following what happens when a request is made to an application. The Genesis Tracing module enables you to generate tracing data for your application through an integration with industry-standard OpenTelemetry.
OpenTelemetry is an Observability framework and toolkit designed to create and manage telemetry data, such as traces, metrics, and logs. This data enables you to understand the internal state of a system and the way that the server responds to requests from the front end.
To enable tracing, you need to add the OpenTelemetry Java agent to your application's JVM options. You can read more about the OpenTelemetry Java agent here. In short, the Java agent dynamically injects bytecode to capture telemetry from a number of popular libraries and frameworks. Genesis takes advantage of this, along with its own manual instrumentation.
What's instrumented
Data is generated on the following activities (is instrumented, as OpenTelemetry would say):
- Inbound messages over HTTP and WebSockets
- Inter-process messaging
- JDBC operations (if using a SQL database)
Span attributes
OpenTelemetry organises data within spans. A span is a unit of work or operation. It tracks specific operations that a request makes, so that you can see what happened during the time in which that operation was executed.
Each span contains a number of attributes. For instance, an HTTP request span has attributes detailing status code, http method etc. The following Genesis-specific attributes are added to the inbound message spans:
- Message Type
- Source Ref
- Username (if present)
- Payload
The table below shows example values for the Genesis-specific attributes listed above. Screenshots of traces in Zipkin can be seen at the bottom of the page.
| Attribute | Value |
|---|---|
| genesis.message_type | EVENT_TRADE_INSERT |
| genesis.source_ref | 6045bdfffe1177d3-00005df4-00000004-1f1e5fe74723987e-c672dc68:1 |
| genesis.username | DonDolle |
| genesis.payload | {"MESSAGE_TYPE":"EVENT_TRADE_INSERT","USER_NAME":"DoneDolle","SESSION_AUTH_TOKEN":"********","REFRESH_AUTH_TOKEN":null,"VALIDATE":false,"IGNORE_WARNINGS":true,"DETAILS":{"INSTRUMENT_ID":"VOD","COUNTERPARTY_ID":"GENESIS","QUANTITY":10,"PRICE":1.5,"SIDE":"BUY"},"SOURCE_REF":"1"} |
Set-up
The OpenTelemetry agent jar is bundled with the Genesis platform in the lib folder. You must specify a path to this folder by making a 'JVM_OPTIONS' entry in your application's system-definition file :
item(
    name = "JVM_OPTIONS",
    value = "-javaagent:${env["GENESIS_HOME"]}/genesis/lib/opentelemetry-javaagent.jar"
)
The Java agent has a number of options that can be used. When you specify the path, you can include these. For example, if you want to use the zipkin exporter:
item(
    name = "JVM_OPTIONS",
    value = "-javaagent:${env["GENESIS_HOME"]}/genesis/lib/opentelemetry-javaagent.jar -Dotel.traces.exporter=zipkin -Dotel.metrics.exporter=none"
)
In the example above, metrics exporting has been disabled. This is because, by default, the agent will try and export metrics that can pollute the Genesis logs.
Other configurations
The OpenTelemetry Java agent is highly configurable. You can find more information about how to configure it in the OpenTelemetry documentation.
The OpenTelemetry Java agent provides defaults for where it exports the data.
By default, the otel.service.name property is set to the Genesis process name.
Example screenshots
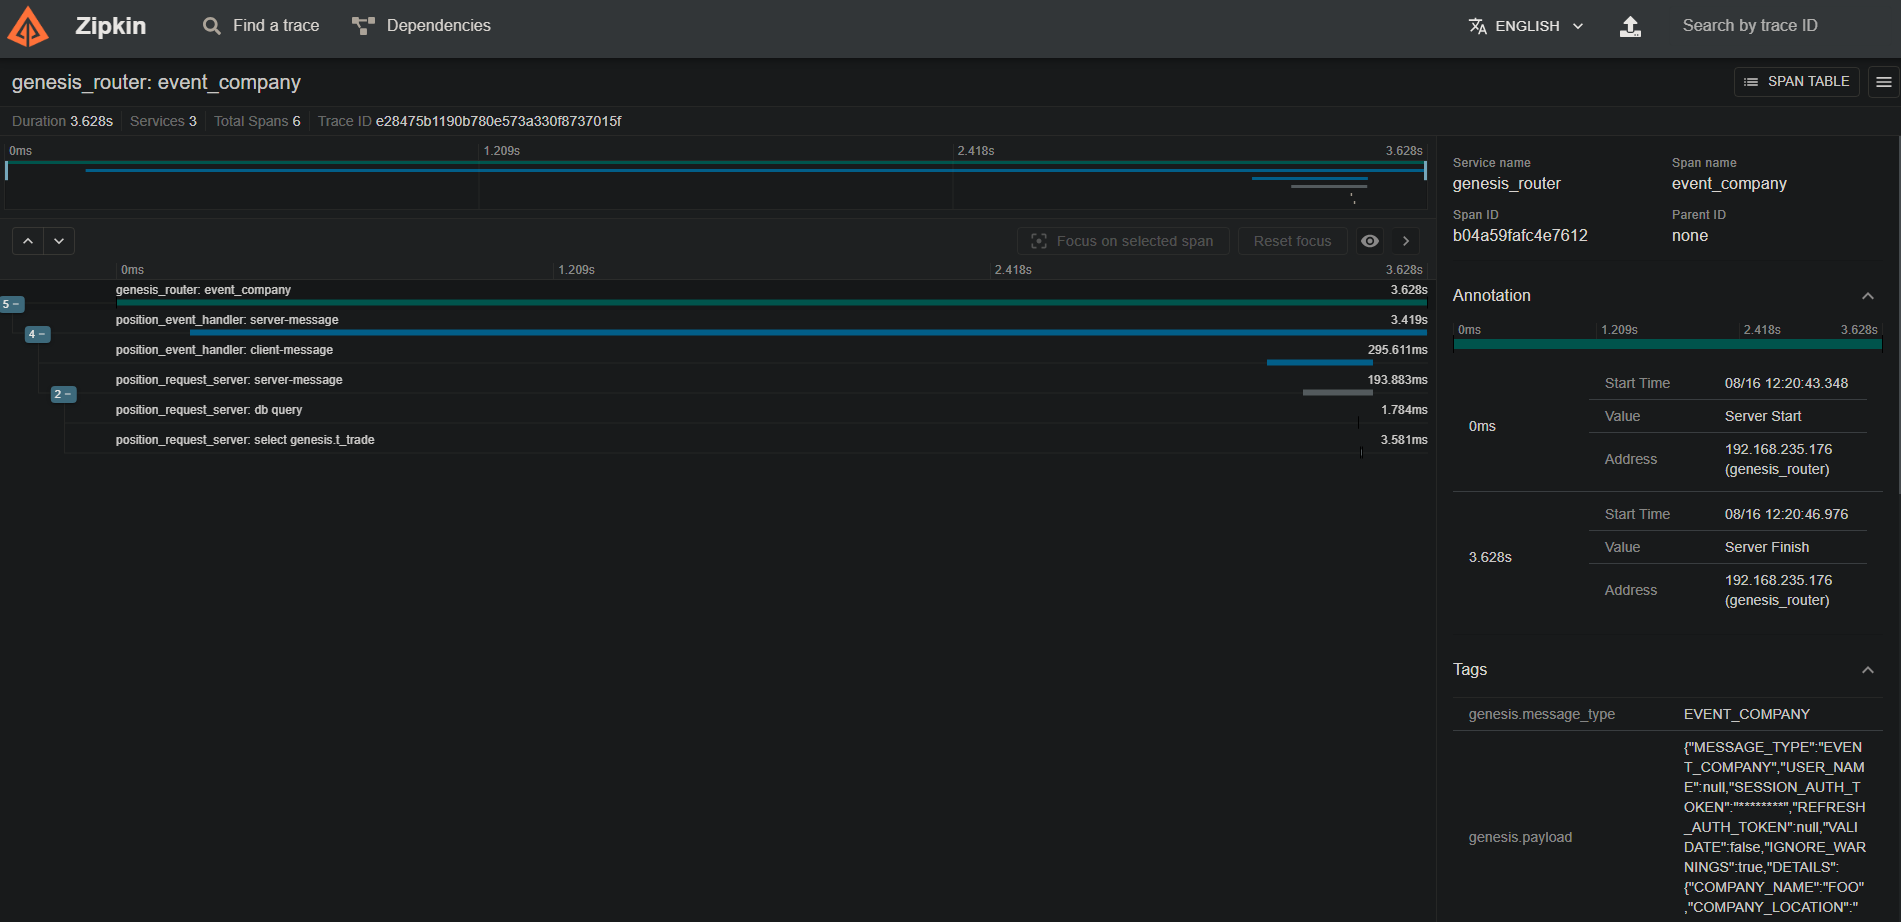
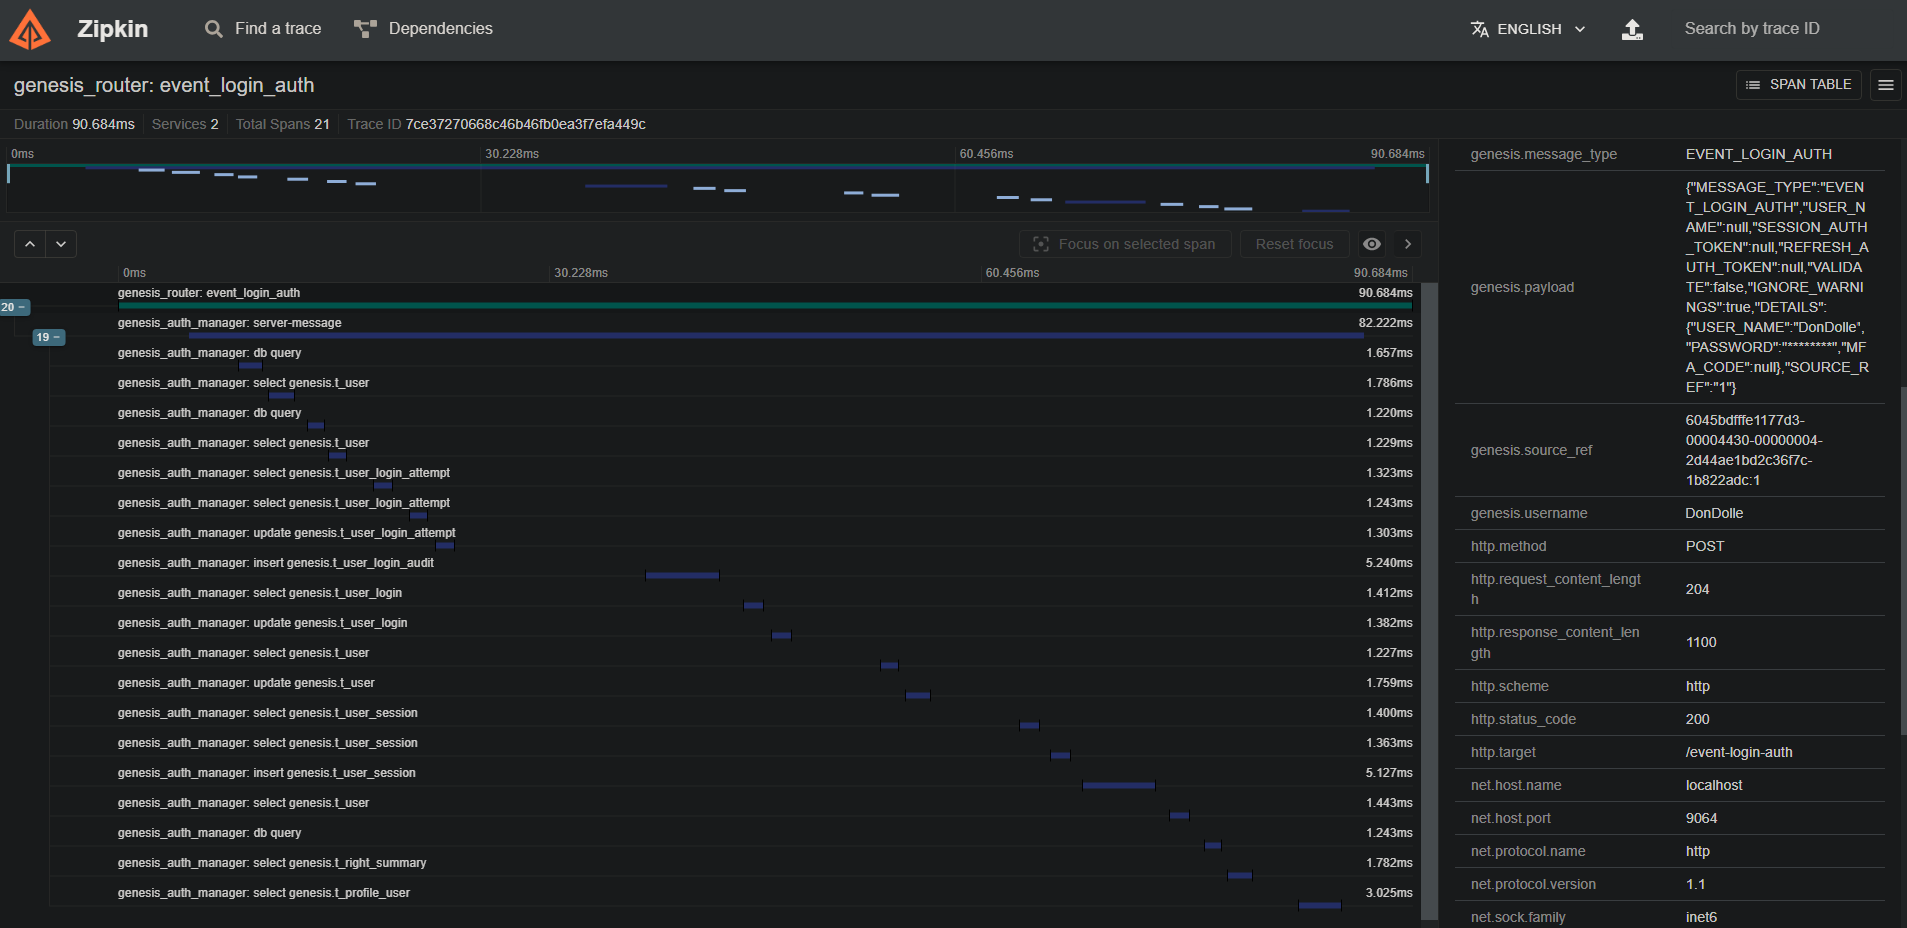
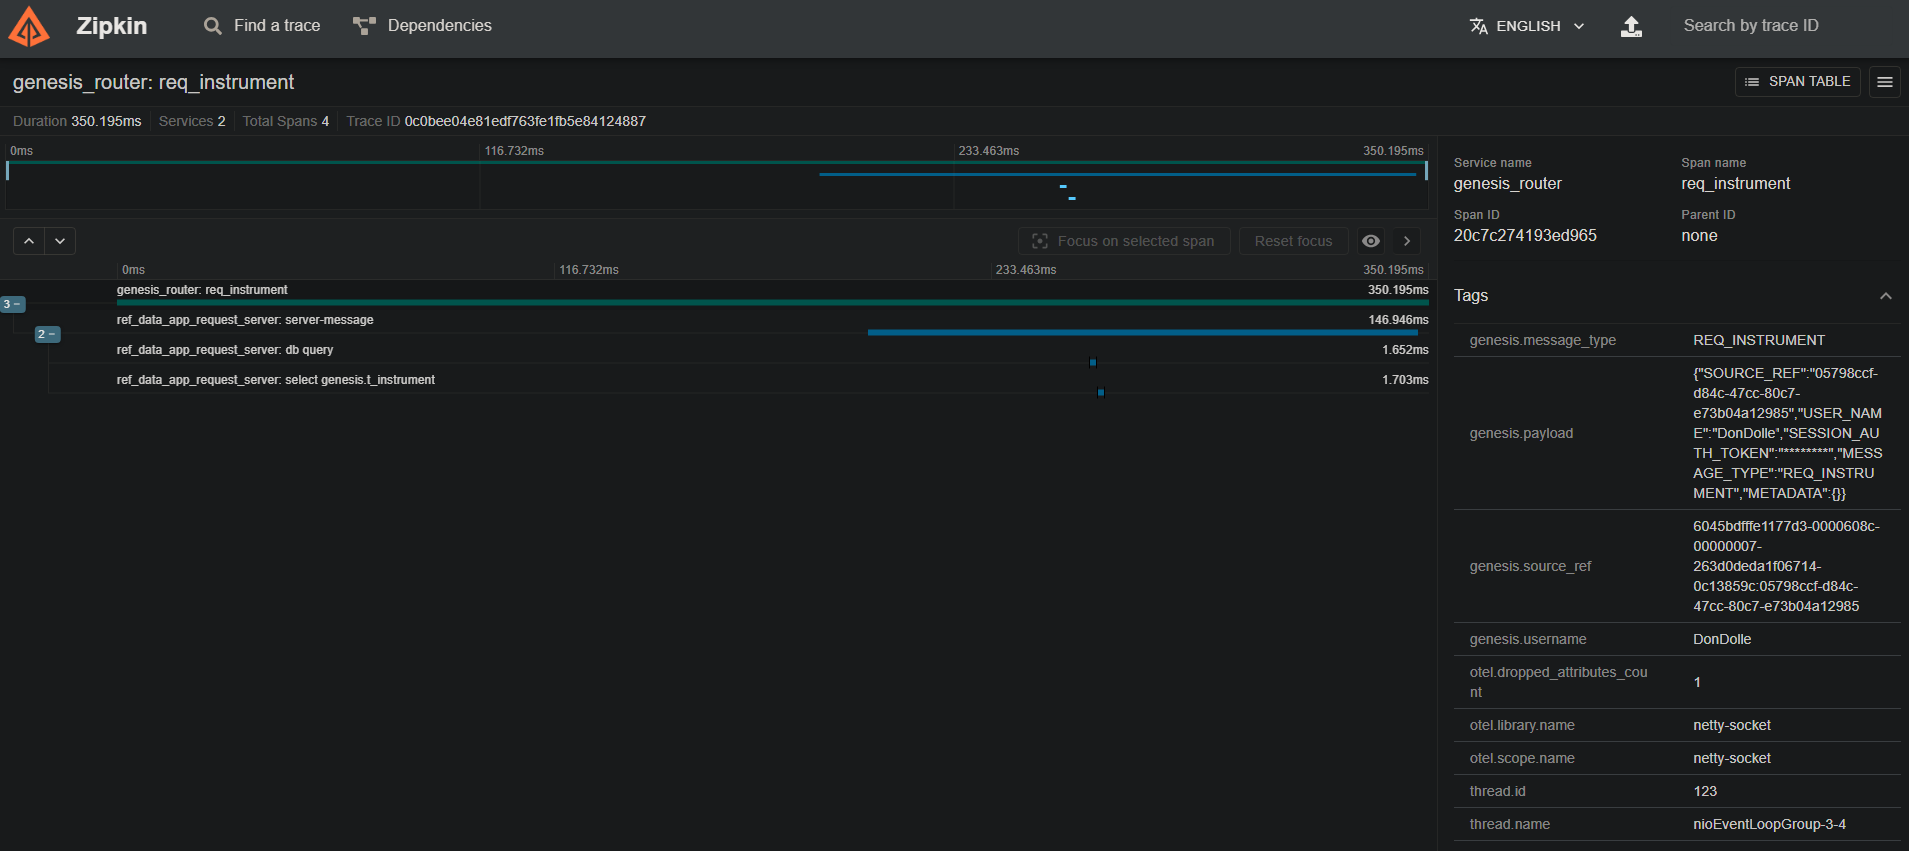
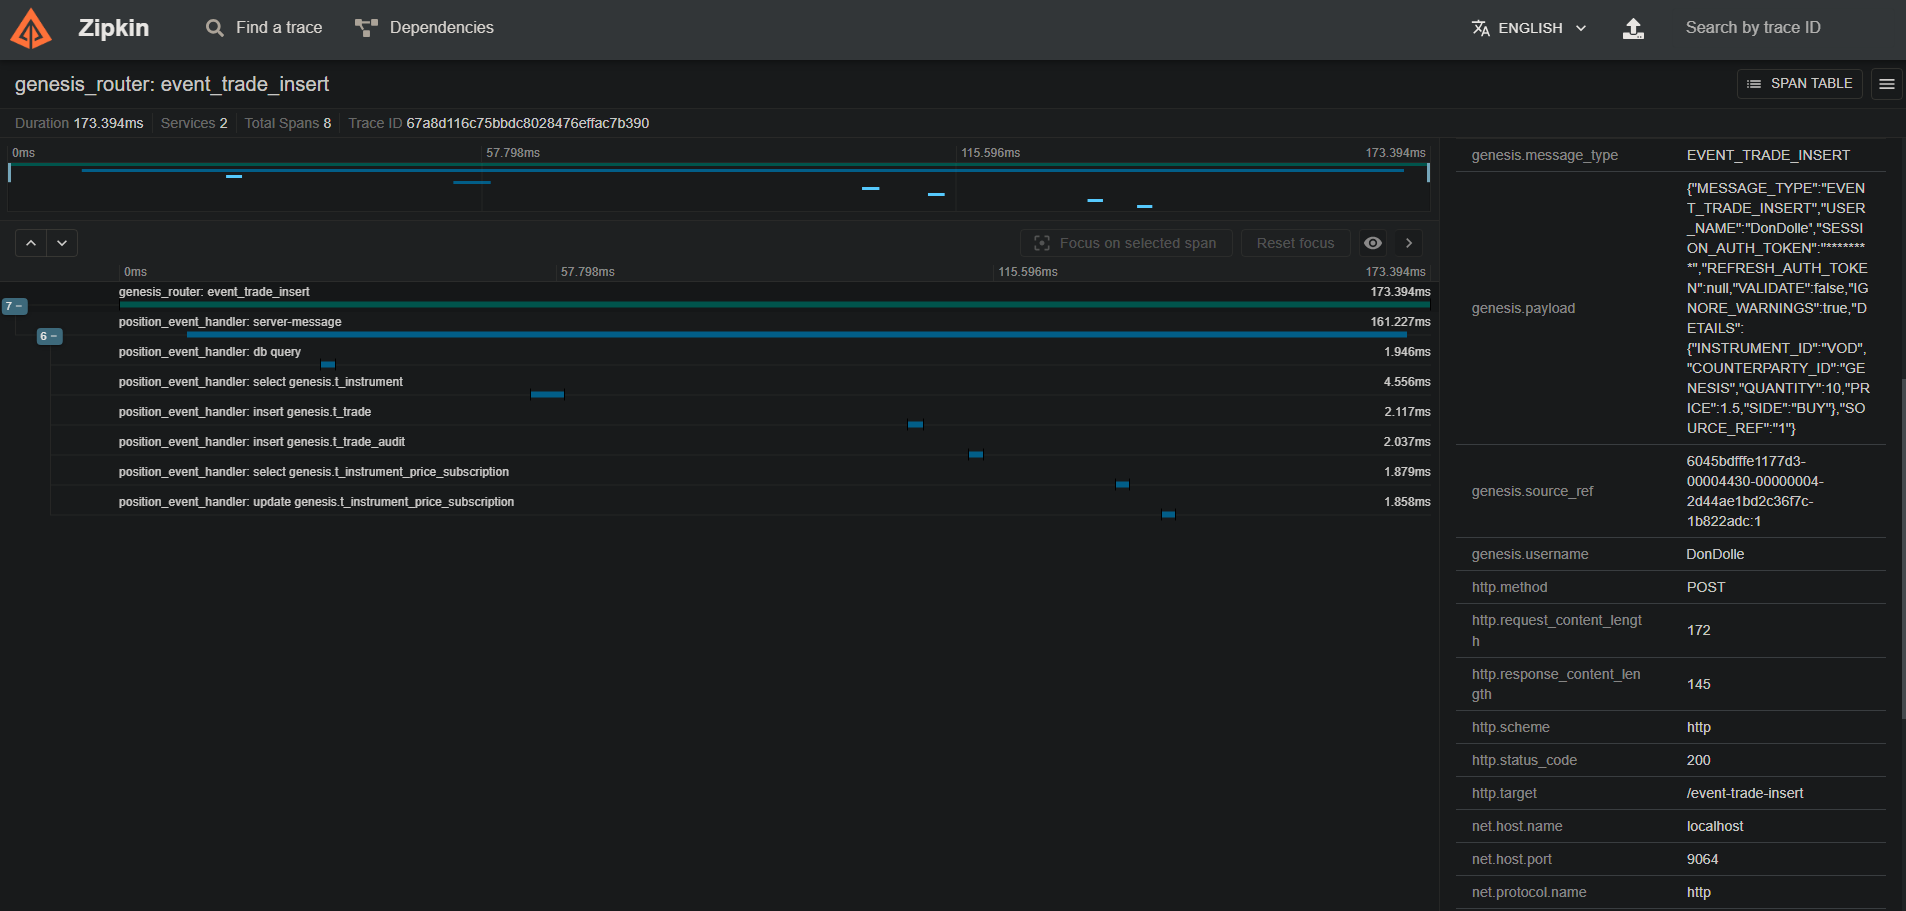
Below are a few screenshots of traces captured in a test Genesis application, viewed in Zipkin:
HTTP Login event:
WebSocket Req Rep message:
HTTP Insert event:
Messages across multiple services: