Web Components - Charts
A chart component is a graphical representation of a set of data. A range of different chart types can be used. Genesis charts are based on g2plot.
Set-up
The examples below are based on an example application called "alpha", so we refer to a design system called @genesislcap/alpha-design-system, which has the prefix alpha. In practice, you decide on the name and prefix of your design system, but it exposes the same API.
import { provideDesignSystem, alphaAgGrid } from '@genesislcap/alpha-design-system';
import { g2plotChartsComponents } from '@genesislcap/g2plot-chart';

provideDesignSystem().register(alphaAgGrid(), g2plotChartsComponents);
Attributes and properties
When you declare an <alpha-g2plot-chart>, you can provide the following attributes:
| Name | Type | Description |
|---|---|---|
| type | string | Sets the type of the chart: area, donut, dual-axes, pie, rose, scatter, stock. Default: Bar. |
| config | - | Sets the configuration for the chart; click on a link to view the g2plot api definition with the settings available for each type of chart: area, bar, column, donut (which is a type of pie), dual-axes, line, mix, pie, rose, scatter, stock. |
| data | - | Where you are not using the <chart-datasource> component (see below), use this attribute to provide the array of data to be displayed in the chart. |
Chart datasource
When using charts, you are offered a component called <chart-datasource>. This component handles the communication and integration with the server. This component has two attributes:
| Name | Description |
|---|---|
| resourceName | Identifies the resource that provides the data; this can be a Data Server query or a Request Server requestReply |
| server-fields | Defines the fields of data to be charted; the first value is associated with the x-axis; the second value is associated with the y-axis; the third value is associated with the data series |
Examples
Below we have a simple example of a configuration for a chart.
- Chart configuration:
chartConfiguration = {
        xField: 'groupBy',
        yField: 'value',
    };
- Below is the declaration of a chart that uses the above configuration. The chart type is
column. It uses thechart-datasourcecomponent to retrieve two fields from theALL_STOCKSresource: SYMBOL (x axis) and TRADING_VOLUME (y axis).
<alpha-g2plot-chart type="column" :config=${(x) => x.chartConfiguration}>
    <chart-datasource
        resourceName = "ALL_STOCKS"
        server-fields = "SYMBOL TRADING_VOLUME"
    ></chart-datasource>
</alpha-g2plot-chart>
- The example below configures a stacked bar chart using the
isStack: truesetting in the .template.ts file for the page.
chartConfiguration = {
    xField: 'groupBy',
    yField: 'value',
    seriesField: 'series',
    isStack: true,
};
- You can then declare the bar chart in the .ts file for the page. This example displays data for three fields in the EXAMPLE_RESOURCE in the database - which could be a table or a view.
<alpha-g2plot-chart type="bar" :config=${(x) => x.chartConfiguration}>
    <chart-datasource
        resourceName = "EXAMPLE_RESOURCE"
        server-fields = "YEAR TRADING_VOLUME CATEGORY"
    ></chart-datasource>
</alpha-g2plot-chart>```
Here is the stacked bar chart that is rendered on the front end:
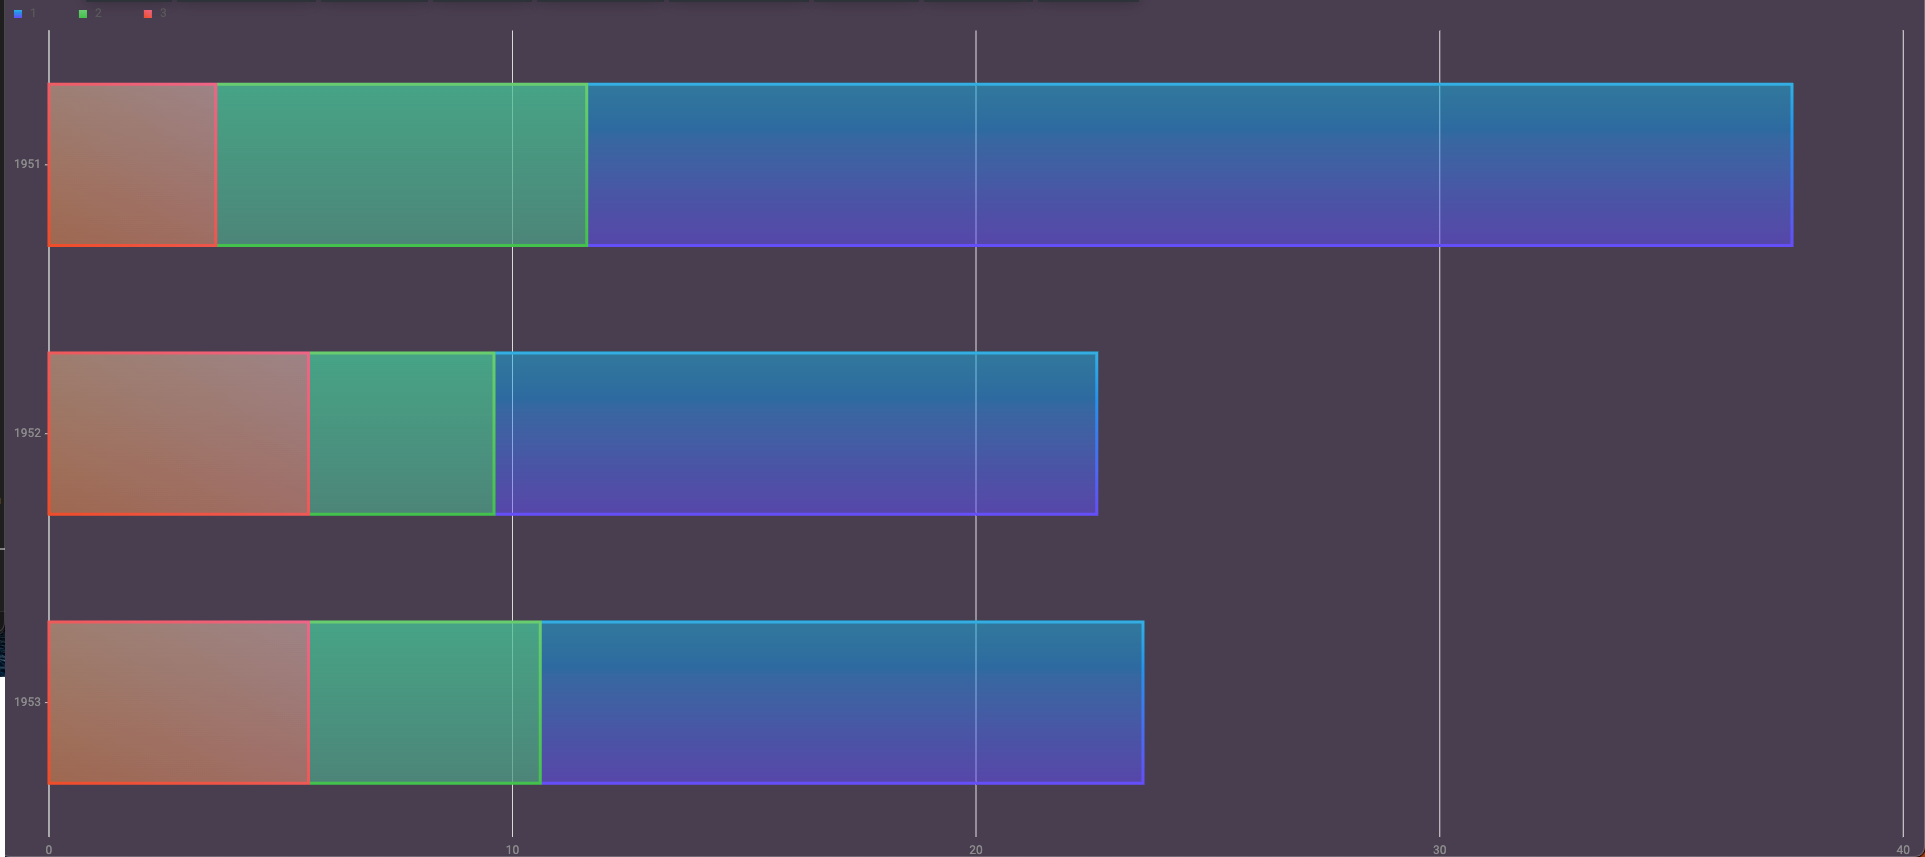
In this stacked bar chart, three years are displayed as bars, and each year has trading volumes for three categories of data.
The chart groups (stacks) these categories for each year into a single bar, with each category displayed in a different colour.
Use cases
- Display data
- Show patterns and relationships